
What analytics can show
Depending on enabled modules and your permissions, analytics can summarize:- Incoming and resolved work.
- Ticket and case workload.
- Rank request outcomes.
- Event activity and attendance coverage.
- Staff duty patterns.
- Provider failures and unresolved operations.
Read coverage first
Every metric depends on the records Rodyne could observe. Before interpreting a trend, check:- The time range.
- Whether the module was enabled for the whole range.
- Whether Discord or Studio ingestion had downtime.
- Whether filters exclude part of the workspace.
- Whether the metric counts created records, resolved records, people, or provider targets.
Avoid false comparisons
- A shorter resolution time can reflect easier work, not better quality.
- Ticket volume can rise after a new panel makes support easier to access.
- Attendance duration is not an event pass rate.
- A provider HTTP success is not a verified outcome unless read-back completed.
- Assigned-work counts are permission-filtered for the viewer.
Use analytics operationally
Good review questions include:- Which queue is accumulating unresolved work?
- Which provider or integration is producing repeated failures?
- Are protected workflows waiting for enough independent approvers?
- Did a configuration change create a visible break in data coverage?
- Which records should be sampled for qualitative review?
Guided walkthrough
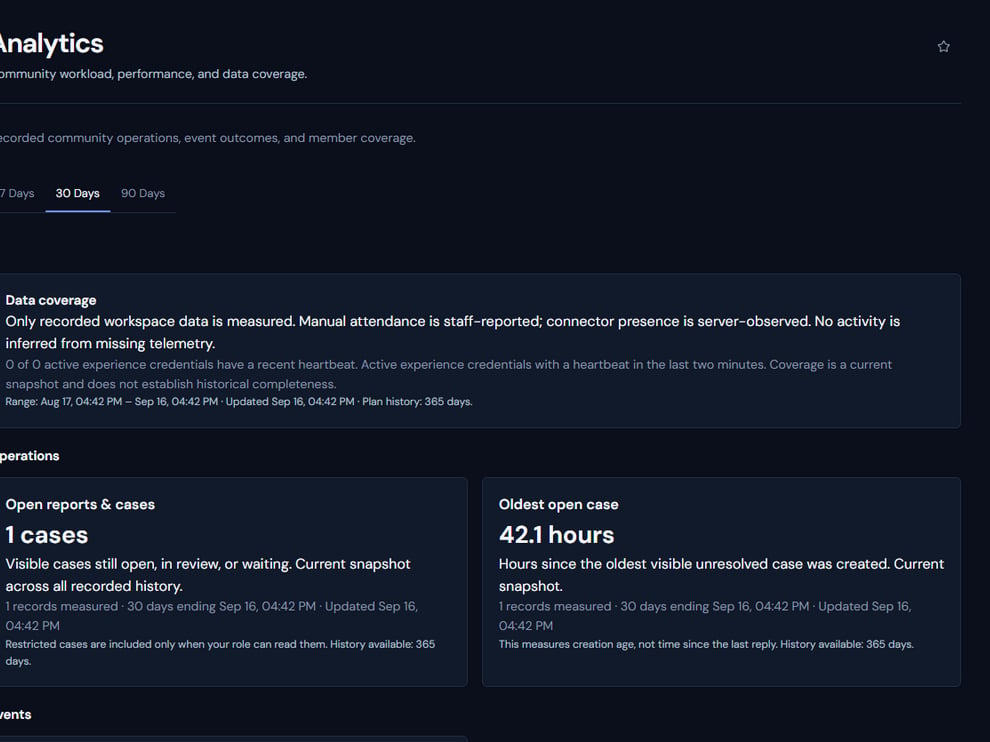
Analytics is read in the context of period, module coverage, and underlying operational records.
Operating procedure
1
Set the question
Choose the operational question before selecting a chart or period.
2
Check coverage
Confirm the module, integration, and selected interval have usable data.
3
Read the denominator
Distinguish records, members, provider targets, and active staff.
4
Compare cautiously
Account for policy, panel, staffing, and ingestion changes between periods.
5
Sample records
Open representative tickets, cases, requests, or events before acting on a trend.